Guides
Inspector
See every request to a share, route or local domain as it happens: headers, bodies, timings, WebSocket messages, webhook signatures. Filter and search, replay and edit, compare, export as HAR or cURL, stub, protect, slow down and break requests on purpose, from the app, the terminal or an AI agent. Everything stays on your computer.
The inspector sits between Cloudflare and your service, on this computer, and records each request and its response while they stream through untouched:
visitor → Cloudflare → cloudflared → inspector (127.0.0.1, in Teitunnel) → your serviceUse it to debug a webhook integration, see what a mobile app really sends, find the slow
request, reproduce a bug with the exact request that caused it, or test how a client copes with
errors. Captures stay on this computer and leave it only when you export or copy them.
Credentials (Authorization, cookies, API keys, webhook signatures and token-like values) are
masked everywhere unless you choose to show them.
What gets inspected
Each inspected share, route or local domain is a tap: a small proxy in Teitunnel, on a random local port, that your traffic passes through.
| Inspected | How to turn it on or off | |
|---|---|---|
| Quick Shares | By default | Inspect requests under Advanced when you share; the default for new shares is Settings ▸ Inspector ▸ Inspect Quick Shares. Changing it for a running share restarts it with a new address (the app asks first). |
| Shares on your domain | By default | The same switch, or --no-inspect. |
| Routes | When you ask | Inspect this route (see below), or teitunnel inspect. |
| Local domains | When you ask | Record requests in the inspector, or --inspect. |
Inspecting a route
Routes aren't inspected until you ask, because it means pointing the route at this computer's inspector in Cloudflare:
- Select the route in Routes and, under Requests, choose Inspect this route.
- The sheet Inspect app.yourhost.com shows the plan: the route points at the inspector on this computer, and its own service is remembered. Choose Start Inspecting.
- Show Requests opens its traffic in the Inspector. The route's section says Its requests go through the inspector on this computer until you stop, or Teitunnel quits.
The route goes back to its own service through another reviewed change:
- when you choose Stop Inspecting;
- when Teitunnel quits (an Always-on connector keeps serving, so the route is restored before the app exits);
- at the next launch, if Teitunnel didn't quit cleanly.
If a route is ever left pointing at an inspector that isn't running, visitors get an error; the route and the Doctor say so (app.yourhost.com points at an inspector that isn't running) with Restore the Route. Only routes this computer serves can be inspected; for other machines, use their live logs.
The Inspector view
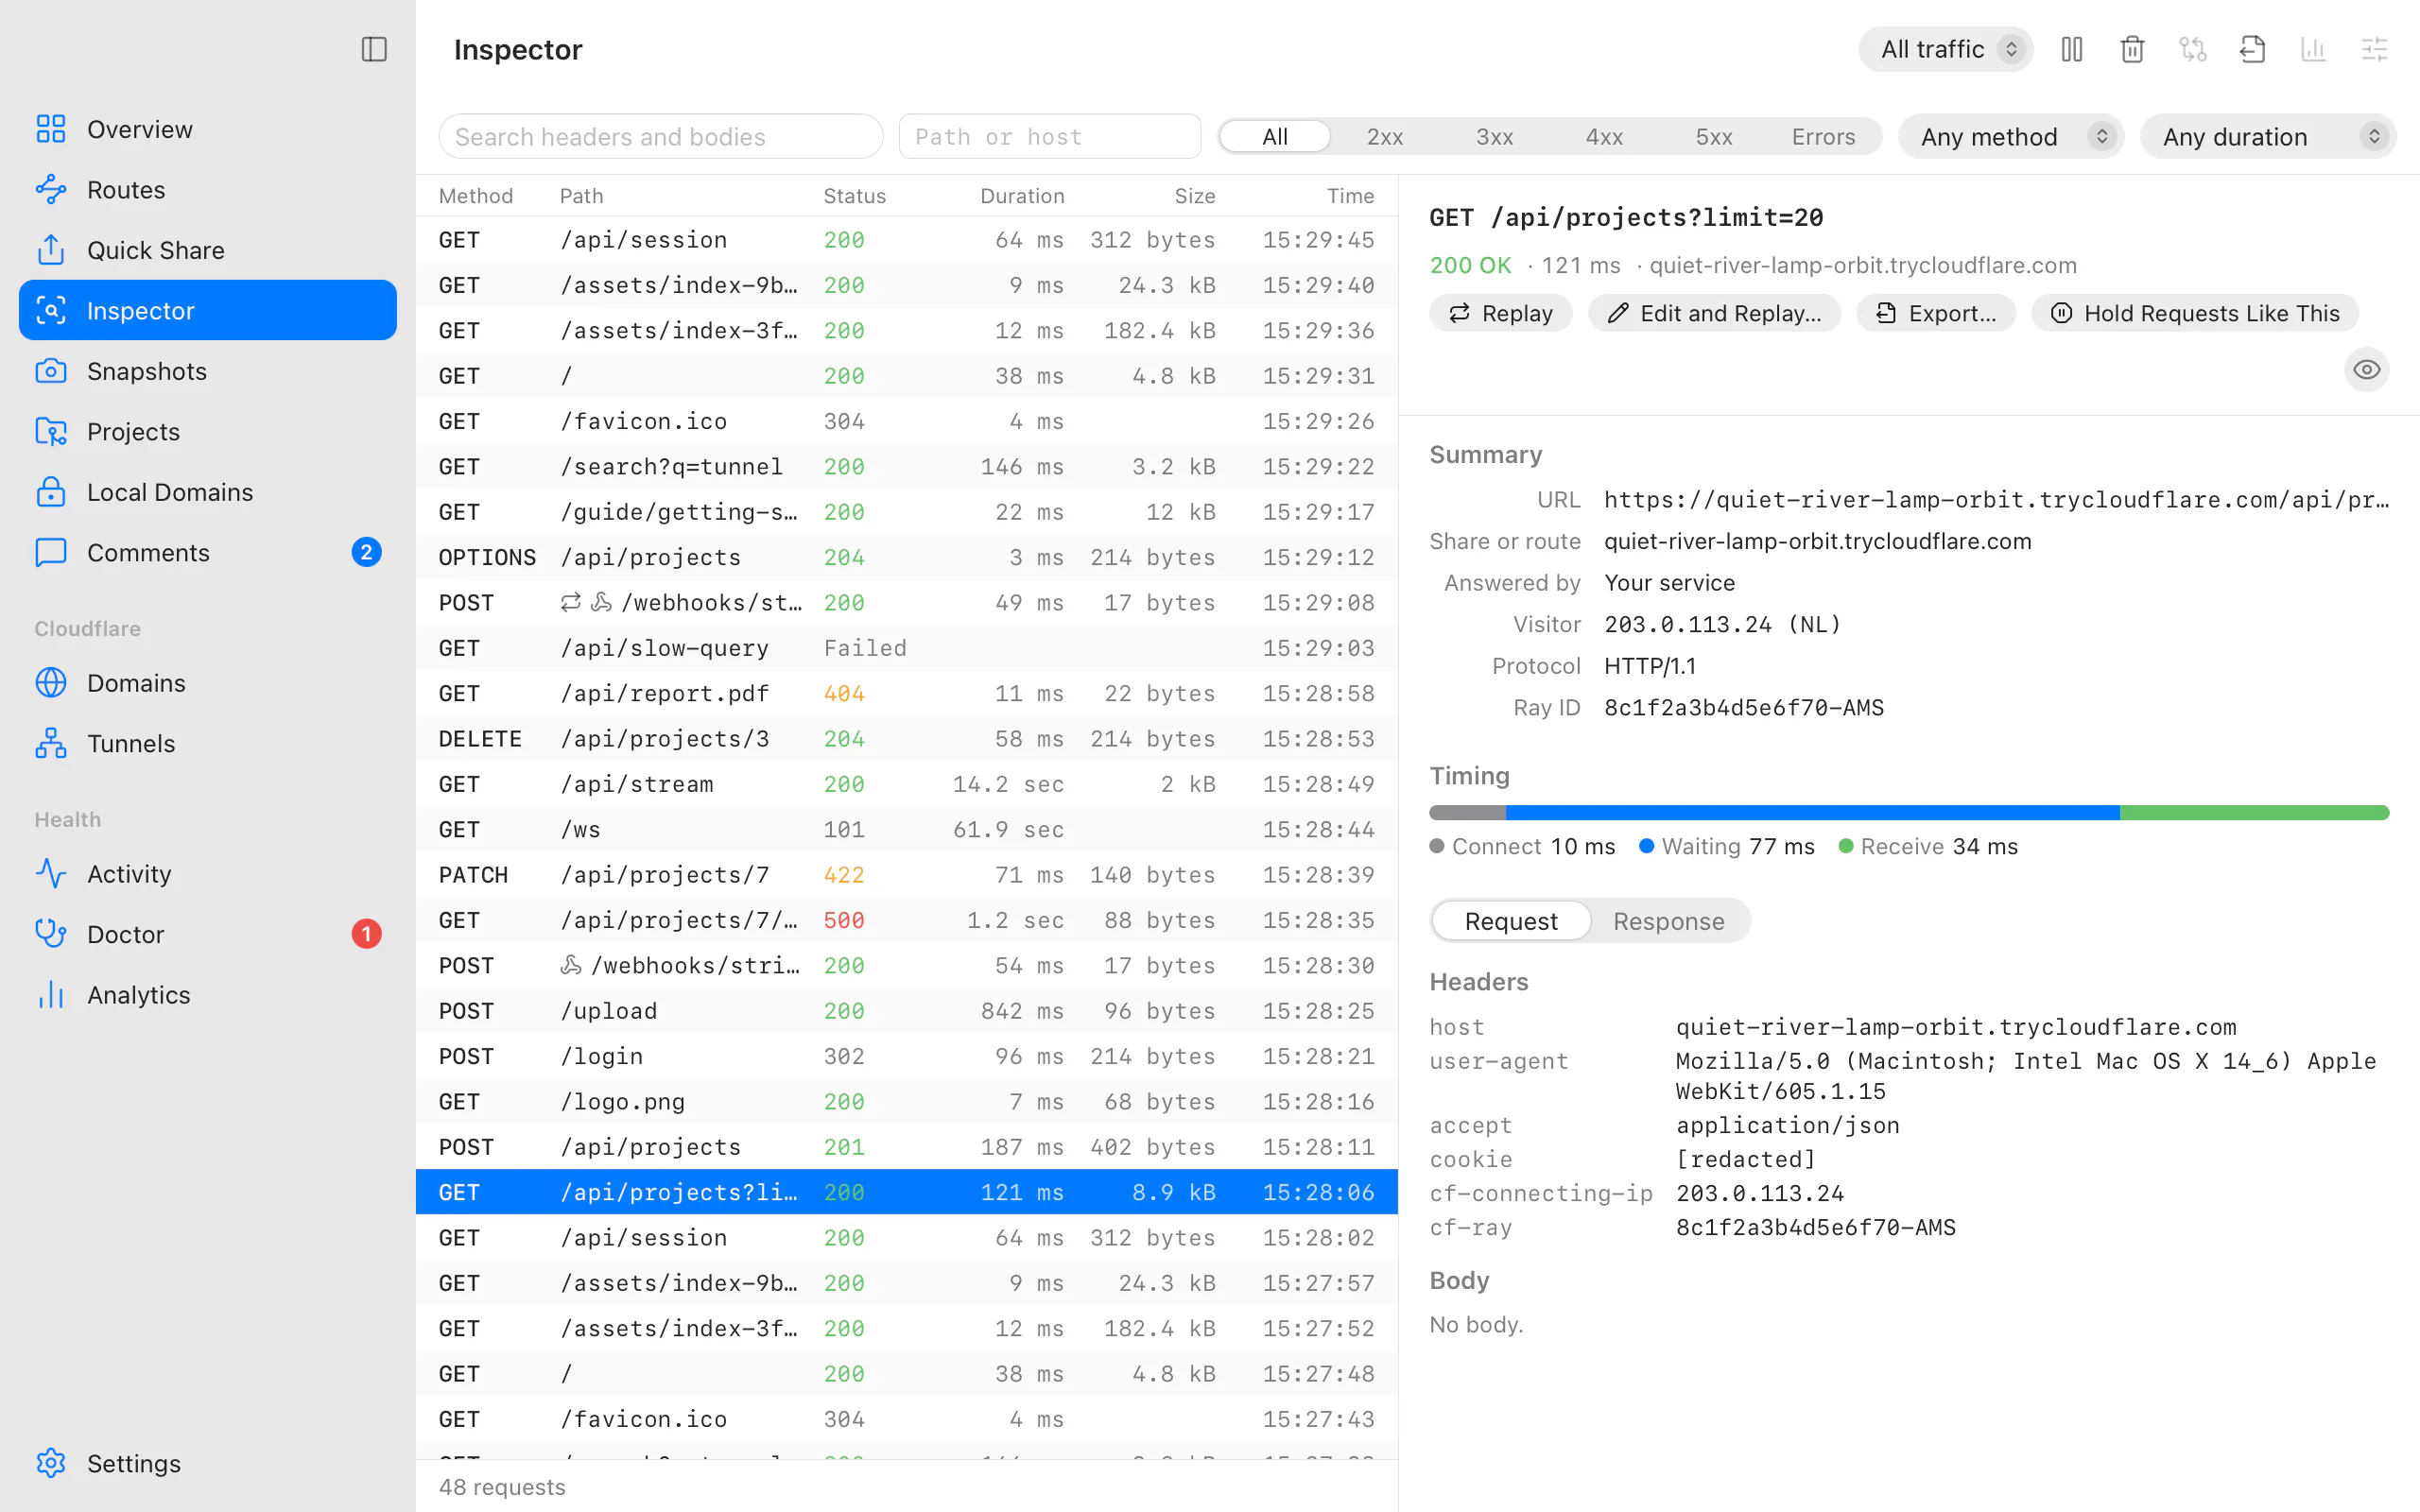
Open Inspector in the sidebar. Show requests from picks one share, route or local domain, or All traffic. New requests appear at the top as they arrive, with a count (248 requests, 95% within 120 ms).
Find the request
Each row shows the method, path, status, duration, size and time; replays, webhooks, WebSockets and event streams are marked. Narrow the list with:
- Status: All, Errors, or a class (2xx, 3xx, 4xx, 5xx);
- Method, and Duration (Over … a threshold);
- Path or host: text in either;
- Search headers and bodies: full-text search inside every captured request and response. Masked values can't be found by searching.
Pause freezes the list while you read (Paused · 12 new requests); Resume catches up. Load Earlier Requests goes back further in the history.
Read it
Select a request. The detail shows:
- Summary: the URL, the share or route, Answered by (your service, the shared folder, a stub, the protection on this computer and why, the paused page or a simulated fault), the visitor's address and country, the protocol and Cloudflare's Ray ID;
- Request and Response: Headers and Body. Bodies are decompressed and shown Pretty (JSON), as a Form, as multipart Parts, as a Preview (images), as Text or as Hex. Up to 1 MB of each body is captured (64 KB of it in the history kept on disk);
- Messages for WebSockets and event streams: each message in either direction, with its size;
- Timing: Connect, Waiting (to the first byte) and Receive.
Show Secrets reveals the masked credentials of this one request until you hide them or select another. They're read on demand and never kept.
Act on it
- Replay sends it to your service again, exactly as captured.
- Edit and Replay… changes the Method, Path, Headers (one per line, as
Name: value) and Body first, and can Send it up to 100 times. Headers you leave alone keep their captured values, masked ones included. - Export… copies or saves it (see below).
- Select two requests and choose Compare Two Requests to see what differs in their headers and bodies.
Clear Requests forgets the captures of the selected tap (or all), including the history on disk.
Webhooks
Stripe, GitHub, Slack, Shopify, Standard Webhooks (Svix, Clerk, Resend…), Twilio, Linear and Discord deliveries are recognised. Choose Add Signing Secret… on a delivery and paste the secret from the provider's dashboard; from then on each delivery shows Signature valid, Signature invalid or Signature expired, and how long before it arrived it was signed. The secret is kept in your keychain for that share or route, never in Teitunnel's database.
With a saved secret, Re-sign in Edit and Replay… gives each replay a fresh, valid signature, so you can replay a webhook after changing your handler without the provider.
Export
Export… (one request) or Export Requests… (the selection) offers cURL, HTTPie, fetch, Raw HTTP, HAR, JSON and Markdown (for an issue or an AI agent). Copy or Save to Downloads. Redact is on: credentials are masked. Untick it only when you need them, and the sheet warns: This export includes credentials. Share it only where they're safe.
WebSocket and event-stream messages
A WebSocket or event stream's Messages tab lists what went each way, with time, size and a preview (the last 500 WebSocket frames, the first 4 KB of each). Filter by Visitor or Service or search the text, and click a message to read it whole, JSON indented, with a copy button.
Traffic numbers
Traffic Numbers (the chart button in the toolbar, with a share or route selected) sums up its captured requests: requests over time and per second, bytes sent, answers by class, response times (P50 · P95 · P99), top paths, countries, browsers, and bots as they name themselves. It refreshes every few seconds while open. See Analytics for Cloudflare's view of your routes.
Per share or route
Choose Inspection Settings… with a tap selected. These are done by the inspector on this computer, so they apply only while Teitunnel (or the command serving it) runs.
| Tab | Settings |
|---|---|
| Responses | Stubs: answer a method and path with a saved status, content type and body, Always or When the service is down (webhook senders stay happy while you restart). Paused page: keep the address and show a "back soon" page with your heading and message. |
| Breakpoints | Hold matching requests (a method and path, such as POST /webhooks/*) before they go to your service, their answers before they go back, or both. See breakpoints. |
| Headers | Rules that Set, Add or Remove request and response headers; the Host header sent to your service; Allow requests from any site (CORS) for development. |
| Network | Simulated network: 3G (300 ms ± 100 ms, about 200 KB/s down), 4G (70 ms ± 20 ms, about 4 MB/s down), Satellite (600 ms ± 50 ms, about 2 MB/s down) or Custom latency and bandwidth. Faults: make a percentage of matching requests fail: Answer with a status code, Drop connection, Delay, or Time out after. |
| More | Keep event streams alive (a comment line after 25 seconds of silence by default, so Cloudflare's 125-second limit never cuts a long stream); Record requests (off passes requests through without keeping them); Watched paths; Stop after no requests for. |
| Protection | See below. |
Breakpoints
A breakpoint holds a request so you can look at it and decide what happens. Add one in the Breakpoints tab, or select a captured request and click Hold Requests Like This. When a request is held, the list shows it as Held, a banner counts what's waiting, and the Inspector opens it:
- Continue sends it on as it is. Change the method, path, headers or body first and the button becomes Continue with Changes (⌘↩ works too);
- Answer Myself… (before the request reaches your service) sends your own status, headers and body, and your service never sees it;
- Drop closes the connection: the visitor gets no answer;
- Continue All in the banner lets everything waiting go on.
A held answer (the response side) can have its status, headers and body changed the same way.
A held request goes on by itself after a minute, so it's answered before Cloudflare stops waiting after 125 seconds (a 524 error). It also goes on when the visitor leaves, when you remove the breakpoints or stop recording, or when the share stops. At most 50 requests are held at once; more go through. Bodies can be edited when they're text up to 1 MB whose size is known; others (binary, compressed, larger, or still arriving) go on untouched. WebSocket connections and event streams are never held. Breakpoints last until the share or route stops being inspected; they're never saved, so a restart can't leave traffic stuck.
Protection on this computer
The Protection tab puts a gate in front of the share or route, enforced by the inspector (It works on Quick Shares too, but only while Teitunnel runs):
- Password page: visitors type a password once;
- Secret link: visitors need the link once, and a cookie lets them back in;
- Basic authentication with a user name and password;
- Bearer token: for API clients and AI tools that send
Authorization: Bearer. The token is shown once; - Allow only these networks and Refuse these networks: IP addresses or ranges;
- Block user agents: AI crawlers (GPTBot, ClaudeBot, CCBot…), Search engines, SEO crawlers, or your own patterns;
- Paths that skip protection, such as
/webhooks/*, so webhook senders still get through.
For a route, protection at Cloudflare's edge keeps working while this computer is off; see protection and require a login.
Watched paths and idle stop
- Watched paths: a notification when a request hits one of them (Request to
/webhooks/stripe). Set them per tap, or for every share and route in Settings ▸ Inspector ▸
Watched paths, one per line, with
*as a wildcard. - Stop after no requests for: a share stops by itself after this long without a request. The default for every share is Settings ▸ Inspector ▸ Stop idle shares (off by default).
History
The last 24 hours of captures are also kept on disk, at most 5,000 per share or route and 256 MB in all, so a restart keeps recent requests and the terminal can read them. Kept captures have credentials masked before they're written, so they can't be revealed later, and a replay from history leaves masked headers out (From history: masked headers are left out of the replay.).
In Settings ▸ Inspector ▸ History: turn Keep recent requests off, choose Keep for (1 hour to 7 days), or Clear… everything.
From the terminal
teitunnel share 3000                        # inspected by default; a line per request
teitunnel share 3000 --no-inspect           # straight to the service
teitunnel share 3000 --idle 30m --watch '/webhooks/*'
teitunnel inspect app.yourhost.com          # inspect a route until Ctrl-C (shows the plan first)
teitunnel inspect app.yourhost.com --off    # restore a route left inspected
teitunnel traffic ls --status 5xx           # captured requests, newest first
teitunnel traffic get 7f3a9c1b --format curl
teitunnel traffic watch --path /webhooks    # follow new requests until Ctrl-C
teitunnel traffic replay 7f3a9c1b --set-header 'X-Debug: 1' --times 3
teitunnel traffic export --har requests.har
teitunnel traffic clear
$ teitunnel traffic ls --last 3
14:02:13 POST 500 41 ms 312 B api.yourhost.com/v1/orders 7f3a9c1b
14:02:11 GET 200 18 ms 2.1 KB api.yourhost.com/v1/orders?page=2 0c41d9e2
14:01:58 POST 200 204 ms 95 B api.yourhost.com/webhooks/stripe a9e07b35traffic lsandtraffic watchfilter with--host,--method,--status(404or5xx),--path,--kind(http,ws,sse) and--text(anywhere in the request or response).lsshows--last 20by default; both take--json.traffic get <id>shows one request and its response, by its id or the end of it aslsshows it, as--format markdown(default),curl,httpie,fetch,http,harorjson.traffic replay <id>sends it again, with--method,--path,--body(text, or@file),--set-header 'Name: value'(repeatable) and--times(1 to 100).traffic exportwrites--har FILE, or another--formatto standard output, for the newest--last 100requests matching the filters.traffic clearforgets all captures, or one tap's with--tap.traffic openapidescribes the API the captures show; see OpenAPI from traffic.
teitunnel traffic reads the history that the app and every teitunnel command with an
inspector write, so it shows their requests too. teitunnel inspect shows its plan and asks
first (--yes doesn't ask), prints requests while it runs, and points the route back when you
press Ctrl-C.
AI agents
Agents read the same captures through Teitunnel's MCP server: traffic_list, traffic_get,
traffic_replay, wait_for_request (blocks until a matching request arrives: webhook testing
without polling), traffic_stats, traffic_export and traffic_openapi. Credentials are
masked unless you started the server with --allow-secrets. See
AI agents.
Put an MCP server or a local AI server online
teitunnel share 8000 --mcp --on mcp.yourhost.comchecks that port 8000 answers MCP, shares it on your domain (Quick Tunnels can't carry the event streams MCP uses), keeps streams alive, and requires a bearer token. It prints ready configurations for Claude Code, Cursor and VS Code. The token is kept in your keychain for that hostname, so clients keep working the next time you share it;teitunnel token mcp.yourhost.comshows it and--newreplaces it.--mcp-pathsets the endpoint when it isn't/mcp,/sseor/.- claude.ai, ChatGPT and other remote clients sign in with OAuth instead of a fixed token:
add the MCP URL as a custom connector and sign in. The browser shows a short code and waits;
Teitunnel asks you, in a dialog showing the same code, whether that app may connect (when the
app isn't running,
share --mcpasks in the terminal). Only allow a connection you just made yourself: an app's name (even "Claude") says nothing about who is using it. Approved connections are listed in AI & Integrations ▸ Shared Servers, where Disconnect stops one at once (a sharing process that can't hear the app notices within 5 seconds). A connection lasts 90 days, then you approve it again. Tokens are for that server's address only, last an hour and renew themselves; Teitunnel keeps only their hashes. A server that asks for credentials itself keeps its own sign-in. - Apps that identify themselves with a published metadata document (claude.ai does) connect
as they are; older apps register themselves first. To accept only the first kind, or to
change how long connections last, use AI & Integrations ▸ Shared Servers (or set
oauthinmcp.jsonin Teitunnel's data folder:{ "oauth": { "dynamicRegistration": false, "maxGrantDays": 30 } }, 1 to 365 days). It applies to the next share you start. teitunnel share 11434 --ai(Ollama; also LM Studio on 1234 and vLLM on 8000) shares a local AI server behind a bearer token and prints the OpenAI-compatible base URL and key to use. Add--on ai.yourhost.comfor streaming answers.
Troubleshooting
- "That request isn't captured any more. Only the most recent requests are kept." The capture was dropped from memory (1,000 per tap) or the history. Replay a newer one.
- "The share or route that captured this request isn't inspected any more, so it can't be sent again from here." Start inspecting it again, or copy it as cURL.
- "Only web services (http:// or https://) can be inspected." SSH, TCP and other routes pass through cloudflared directly.
- "… isn't a route served by this computer." Inspect it on the machine that serves it, or follow its live logs.
- "No captured requests: Teitunnel keeps them in the app's database, which doesn't exist on this machine yet." Nothing has been inspected on this computer yet.
- Requests appear without bodies. Record requests may be off for that tap, or the body is larger than what's captured (Captured the first 1 MB of 2.3 MB.); requests from the history on disk keep 64 KB of each body.
Related
Last updated on
Exposure check
Before a share or route makes a local service public, Teitunnel looks at it for common leaks: .env files, the git folder, backups and database dumps, framework debug pages, open admin panels and database tools, Jupyter without a token, source maps. What it finds, how it works, and --strict for scripts and CI.
OpenAPI from traffic
Describe an API from the requests Teitunnel's inspector captured: an OpenAPI 3.1 file with paths, parameters, JSON schemas, status codes and authentication, for documentation, client generators and AI agents. What it infers, what it leaves out, and why no captured value ends up in the file.