Guides
Analytics, uptime and alerts
See each Cloudflare Tunnel route's traffic, errors and response times from Cloudflare's edge, check its uptime every minute through Cloudflare, and get alerts when it goes down, answers with errors or slows down. In the app, with teitunnel analytics and uptime, and through the server API.
Teitunnel shows how every route is doing in one place: how many requests it gets, which answers it sends, how fast they are, where visitors come from, and whether it has been up. Use it to spot a route that started failing, to see whether a launch brought traffic, or to keep an eye on a self-hosted service without setting up monitoring.
Three sources work together:
| Where it comes from | Covers | |
|---|---|---|
| Traffic | Cloudflare's GraphQL Analytics API | Every request to the hostname, whichever machine served it |
| Uptime | A check through Cloudflare's edge every minute, from this computer | Routes this computer serves |
| Alerts | Uptime checks, traffic and this computer's connectors | Routes this computer serves |
Precise per-tunnel counts from this computer's own connector are in Tunnels ▸ Traffic, and individual requests in the inspector.
In the app
-
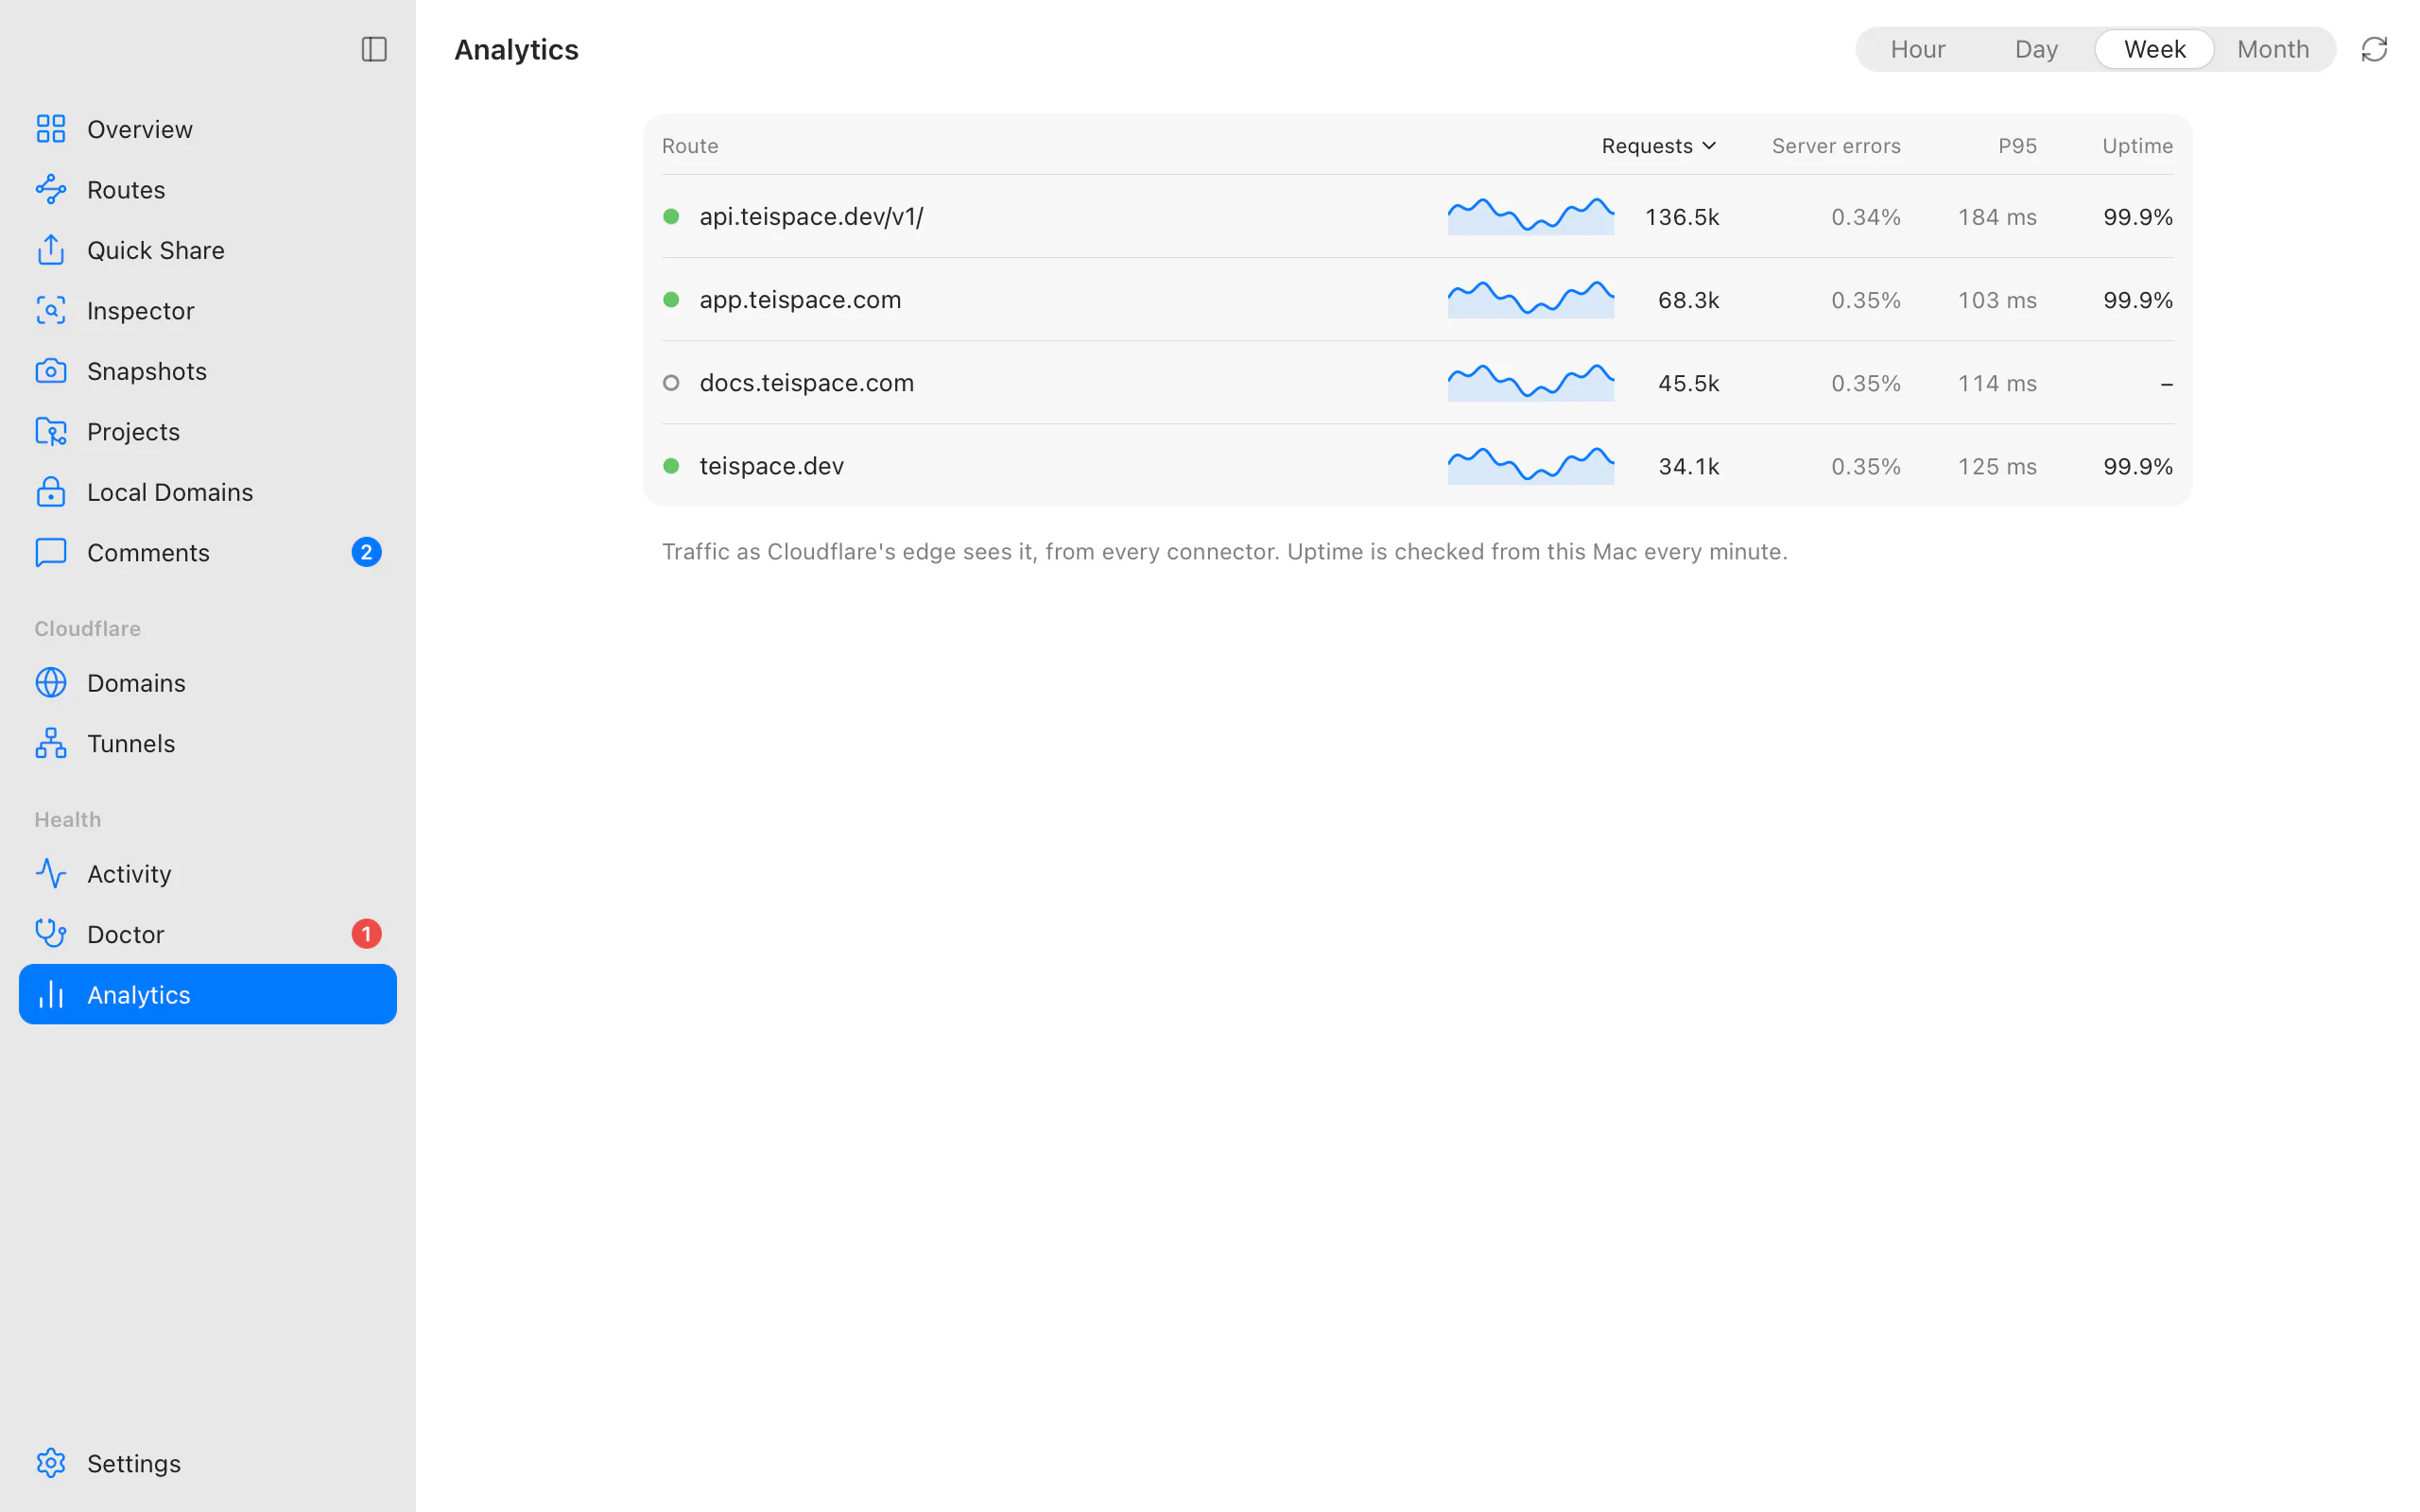
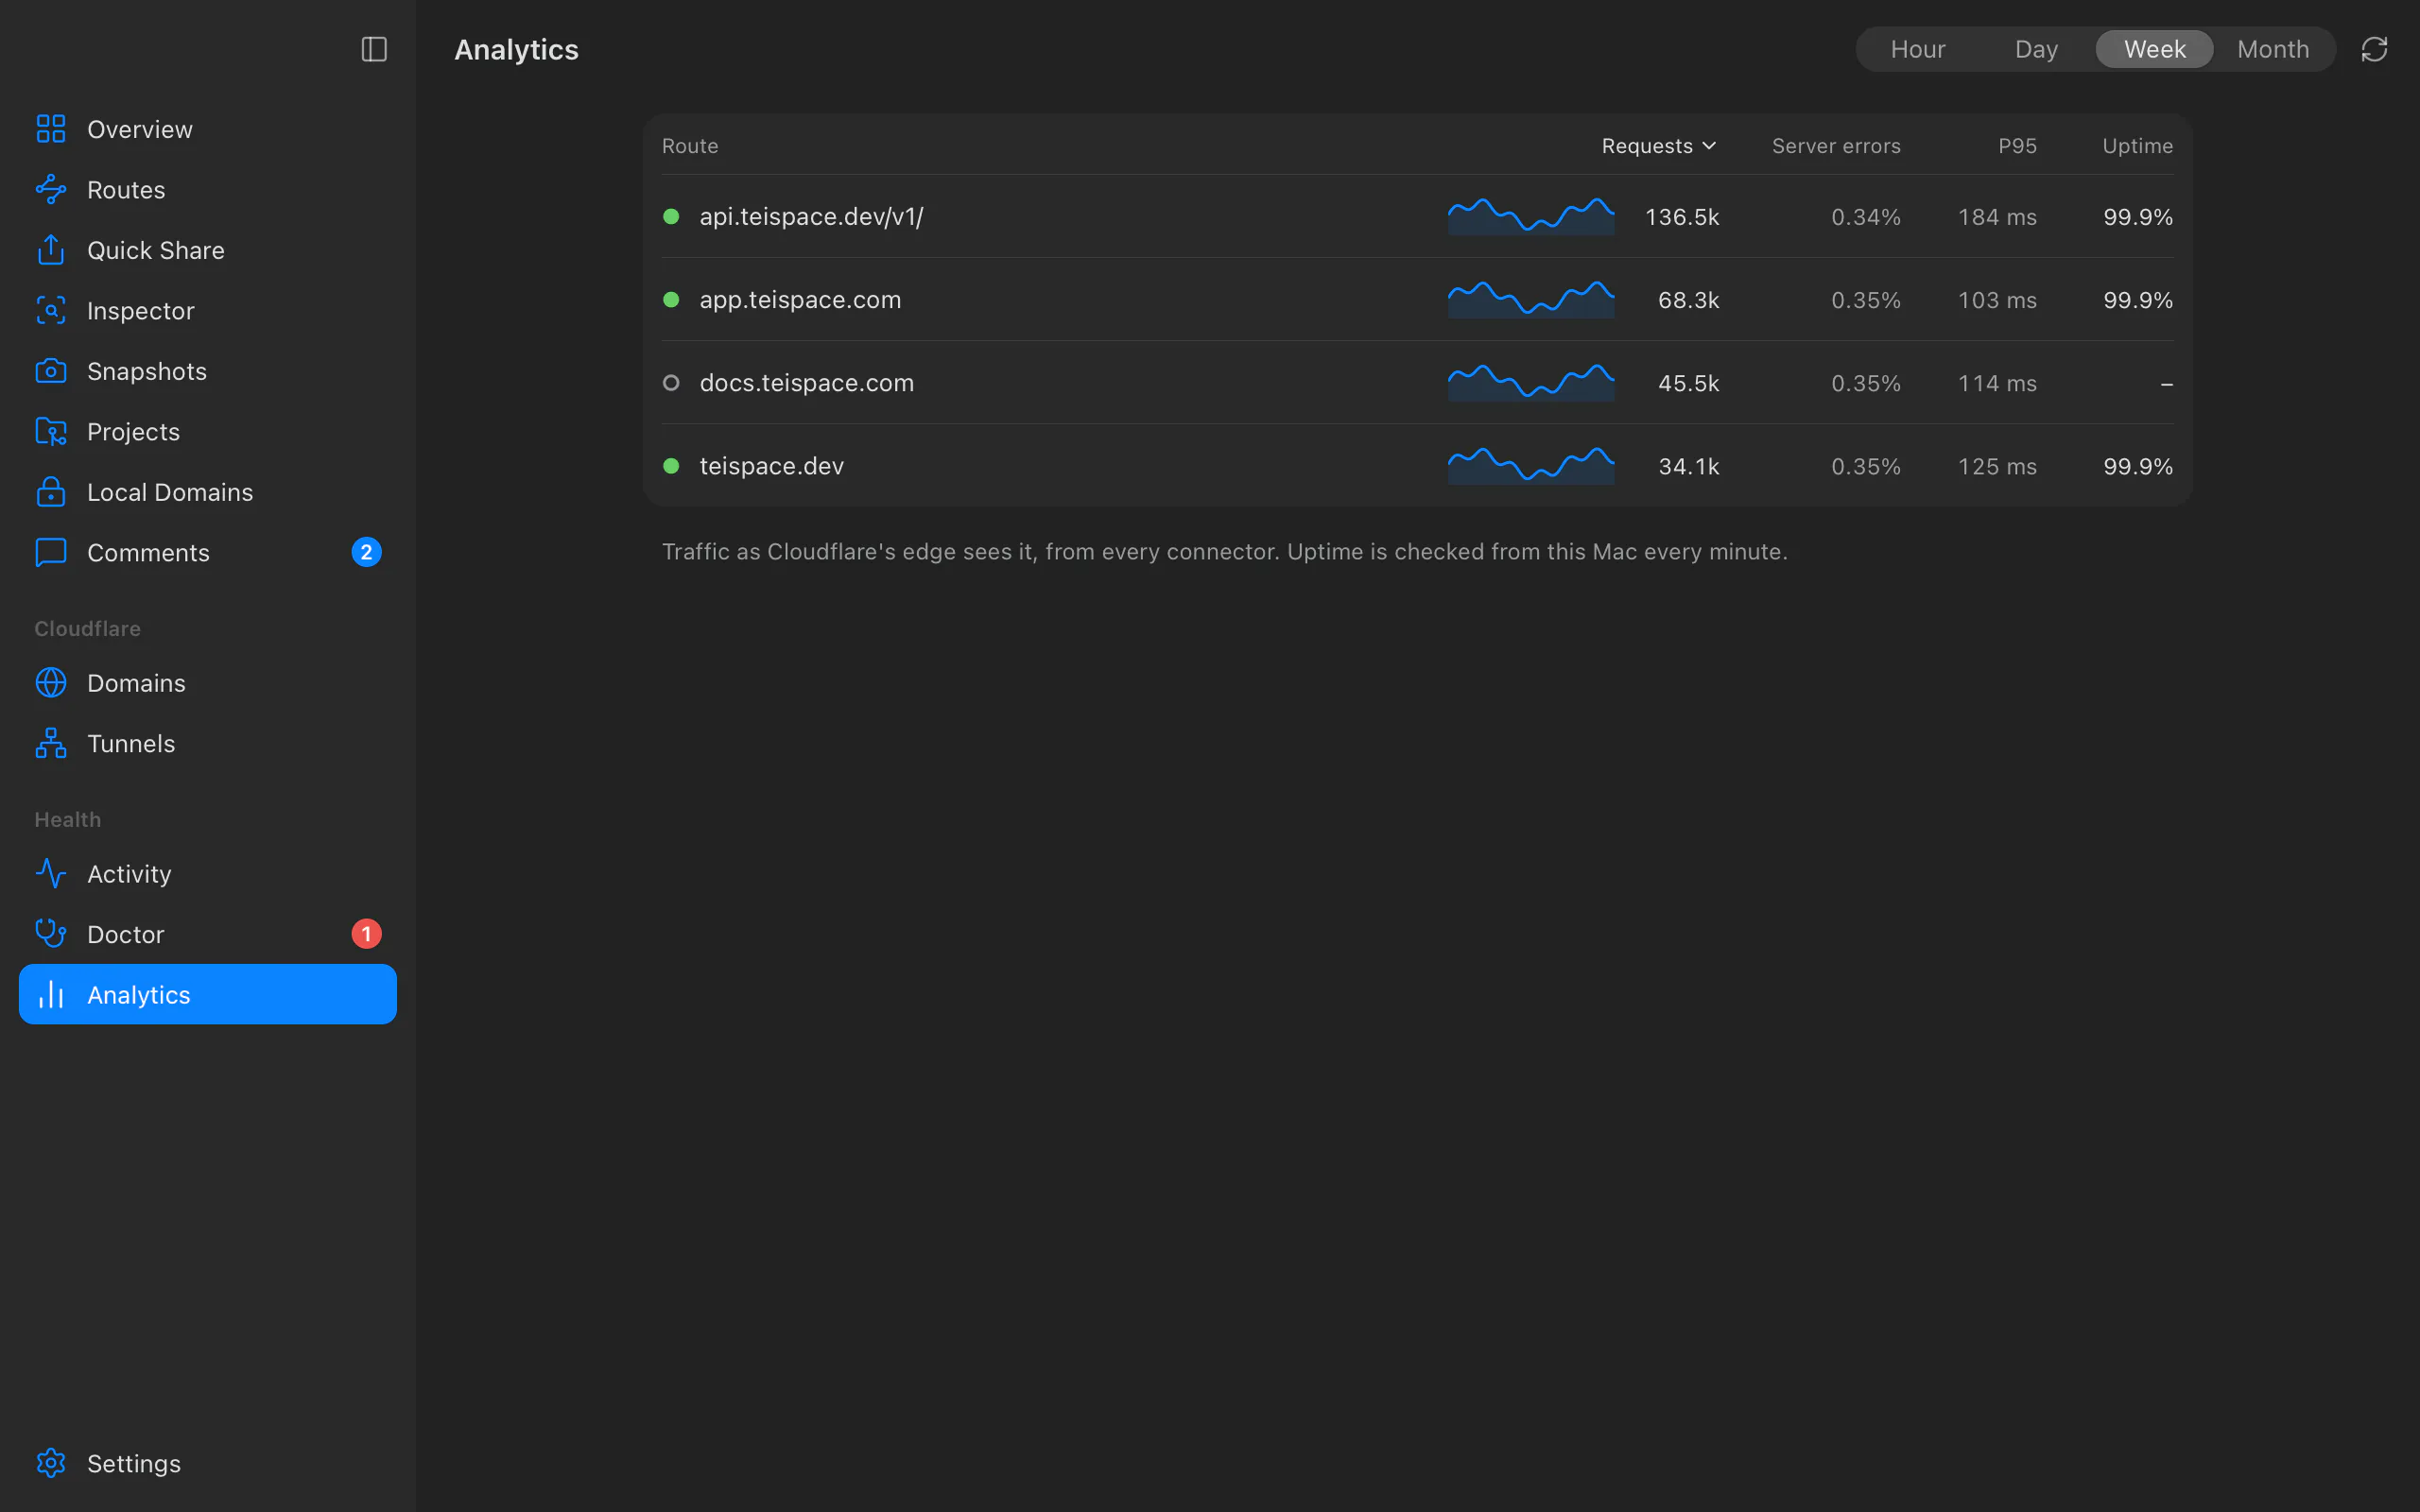
Analytics in the sidebar lists every route of the account side by side: a sparkline of Requests, the share of Server errors (5xx), the P95 response time and the Uptime. Choose Hour, Day, Week or Month, and sort by any column. Routes served by other machines show Not on this Mac for uptime.
-
In Routes, a selected route's Analytics section shows it in detail:
- Uptime with a status strip (each slice up, down or Not checked), the uptime over the period, Response time through Cloudflare and Incidents (Ongoing, since 14:05, or when and for how long, with the cause, such as Service unreachable);
- Requests over the period, Per second (0.23 on average · 0.37 at peak; the peak is the busiest minute, hour or day, depending on the period), Sent bytes and Responses by class;
- Origin time (P50 · P95 · P99) and Time to first byte;
- Top paths, Countries, Browsers, Verified bots, People and other clients, and Cache status.
A label says where the numbers come from: From Cloudflare's edge, From this Mac's connector, or From the local inspector (when the route is inspected, the inspector answers first).
-
In the Inspector, Traffic Numbers (the chart button in the toolbar) shows the same numbers for the selected share or route from its captured requests: exact, and the only numbers there are for a Quick Share, which Cloudflare's analytics don't cover. It offers the periods the inspector's history keeps (24 hours unless you changed it in Settings ▸ Inspector). Bots there are listed as Bots, as they name themselves: the inspector reads each request's
User-Agent(search engines, AI crawlers and assistants, link previews, monitors, webhook senders, command-line tools), but unlike Cloudflare it can't check the claim. -
The Traffic, Errors and Uptime tiles on Overview open Analytics.
Traffic from Cloudflare's edge
Traffic numbers come from Cloudflare's GraphQL Analytics API, so they cover every request to the hostname, whichever machine served it, including requests Cloudflare answered itself (a login page, a cached file, an error). They need one more token permission: Zone · Analytics · Read (the token template also asks for Account · Account Analytics · Read). If the token lacks it, the section says Traffic needs one more permission and shows how to add it to the existing token, then checks again when you come back; nothing needs pasting. Sign in with Cloudflare asks for it when you connect.
What you see depends on the domain's plan. Cloudflare keeps a limited history per plan, and some breakdowns, such as response-time percentiles, need a paid plan. When the plan doesn't offer something, Teitunnel shows what it has and says what's missing: Not on this domain's plan: response times. or This domain's plan keeps traffic since ….
Answers are cached for a minute (Hour), 5 minutes (Day), 15 minutes (Week) or half an hour (Month), so the views stay well inside Cloudflare's limit of 300 analytics queries per five minutes. If the limit is reached anyway, Teitunnel says Cloudflare's analytics limit is used up for a moment. and tries again shortly.
Uptime
While the app, teitunnel up or teitunnel serve runs, every route this computer serves is
requested through Cloudflare's edge once a minute, as a visitor would, and the answer is
recorded with its response time.
- Two failed checks in a row open an incident; the next good one closes it. Each incident keeps its cause: No connector, Wrong tunnel, DNS record, Service unreachable, Service timed out, Server error, Certificate, Address refused, Limit reached…
- A route behind a login counts as up when Cloudflare asks for the login.
- Checks are kept for two days and summed per hour for 30 days, so uptime shows for 24 hours, 7 days and 30 days.
- Nothing is recorded while your computer is offline, and failures right after it wakes from sleep get another minute, so a closed laptop doesn't look like an outage.
- Only one process checks at a time: the app and
teitunnel upon the same computer don't check twice.
Uptime measures the whole path (Cloudflare, the tunnel, the connector and your service) from this computer's network. It's an honest picture of whether your route answered, not an external monitor: when this computer is off, nothing is checked, and routes served by other machines are checked there.
Alerts
Set them in Settings ▸ General ▸ Alerts:
| Alert | Default |
|---|---|
| A route is down | On, after 3 failed checks in a row (Checks before a route counts as down) |
| A route is back up | On |
| Too many server errors | On, when 5% of at least 20 requests over 10 minutes are 5xx (Error rate that alerts) |
| Slow responses | Off; when enabled, P95 response time through Cloudflare above 3,000 ms over 10 minutes (Response time that alerts) |
| A connector loses Cloudflare | On |
An alert fires once when a problem starts (app.yourhost.com is down, app.yourhost.com answers with errors, app.yourhost.com is slow, laptop lost its connection to Cloudflare) and once when it ends (app.yourhost.com is back up. It was down for 4 minutes.). The same route notifies at most once every 15 minutes, and several alerts at once are grouped (3 alerts).
- Every alert is recorded in Activity; filter by Alerts, or Only Problems.
- Notifications follow Settings ▸ General ▸ Notifications ▸ Alerts, and Quiet hours (Quiet from, Quiet until) keep them silent at night while still recording them.
teitunnel upandteitunnel serveprint alerts as they happen.
From the terminal
teitunnel analytics                              # every route of this computer, last 24 hours
teitunnel analytics app.yourhost.com --range week
teitunnel analytics api.yourhost.com --path /v1 --range hour
teitunnel analytics app.yourhost.com --json
teitunnel uptime                                 # 24 h, 7 d and 30 d uptime per route
teitunnel uptime --json
$ teitunnel analytics
Teispace
HOSTNAME REQUESTS 5XX P95 UPTIME
app.yourhost.com 18204 0.2% 84 ms 100%
api.yourhost.com 5530 1.4% 210 ms 99.3%
$ teitunnel analytics app.yourhost.com --range week
app.yourhost.com
Requests 131840
Per second 0.22/s average · 3.1/s peak
Sent 4.2 GB
Responses 2xx 127311 · 3xx 3140 · 4xx 1206 · 5xx 183
Origin time p50 31 ms · p95 84 ms · p99 212 ms
Top paths
41022 /
20310 /api/cart
…
$ teitunnel uptime
ROUTE 24H 7D 30D P95 STATUS
app.yourhost.com 100% 99.9% 99.8% 92 ms up
api.yourhost.com 99.3% 99.7% 99.7% 240 ms down: The connector can't reach the local service.--range takes hour, day (the default), week or month; --account (-a) picks the
account; --path narrows a route to requests under a path, such as /api. If the token can't read analytics,
the command says how to add Zone ▸ Analytics ▸ Read to it.
Server API
teitunnel serve exposes the same data:
GET /api/analytics?accountId=…&range=dayfor every route of this computer in the account, or with&hostname=…(and optionally&path=…) for one route in detail;GET /api/uptimefor every route's uptime, or?hostname=…&range=…for one route with its status strip, response times and incidents.
See the API reference.
Troubleshooting
- "This account's token can't read analytics. Add the Analytics permission to see traffic." Add Zone · Analytics · Read to the token; the app shows how, in place.
- "This domain's Cloudflare plan doesn't include traffic analytics." Uptime and this computer's connector traffic still work.
- "Cloudflare's analytics limit is used up for a few minutes. Try again shortly." Many views or scripts used the shared budget of 300 queries per five minutes.
- Uptime says Not checked yet. Routes are checked every minute while Teitunnel,
teitunnel uporteitunnel serveruns; the first check comes shortly after it starts. - An incident while the route worked for you. Look at its cause: Service unreachable means the connector couldn't reach your service at that moment, No connector that this computer's connector wasn't connected.
Related
Last updated on
Traffic, logs and notifications
Watch a Cloudflare Tunnel connector's traffic, read logs per connector and per route, follow the live log of any machine running a tunnel, and get notified when a connector goes down, keeps crashing or the Doctor finds a problem. In the app and from a terminal.
Snapshots
Publish a static copy of your site to your own Cloudflare account, so a preview stays online while your computer sleeps: from a folder, a build, or a running dev server, with versions, rollback, a password or a login.